The Pacific Blind Spot
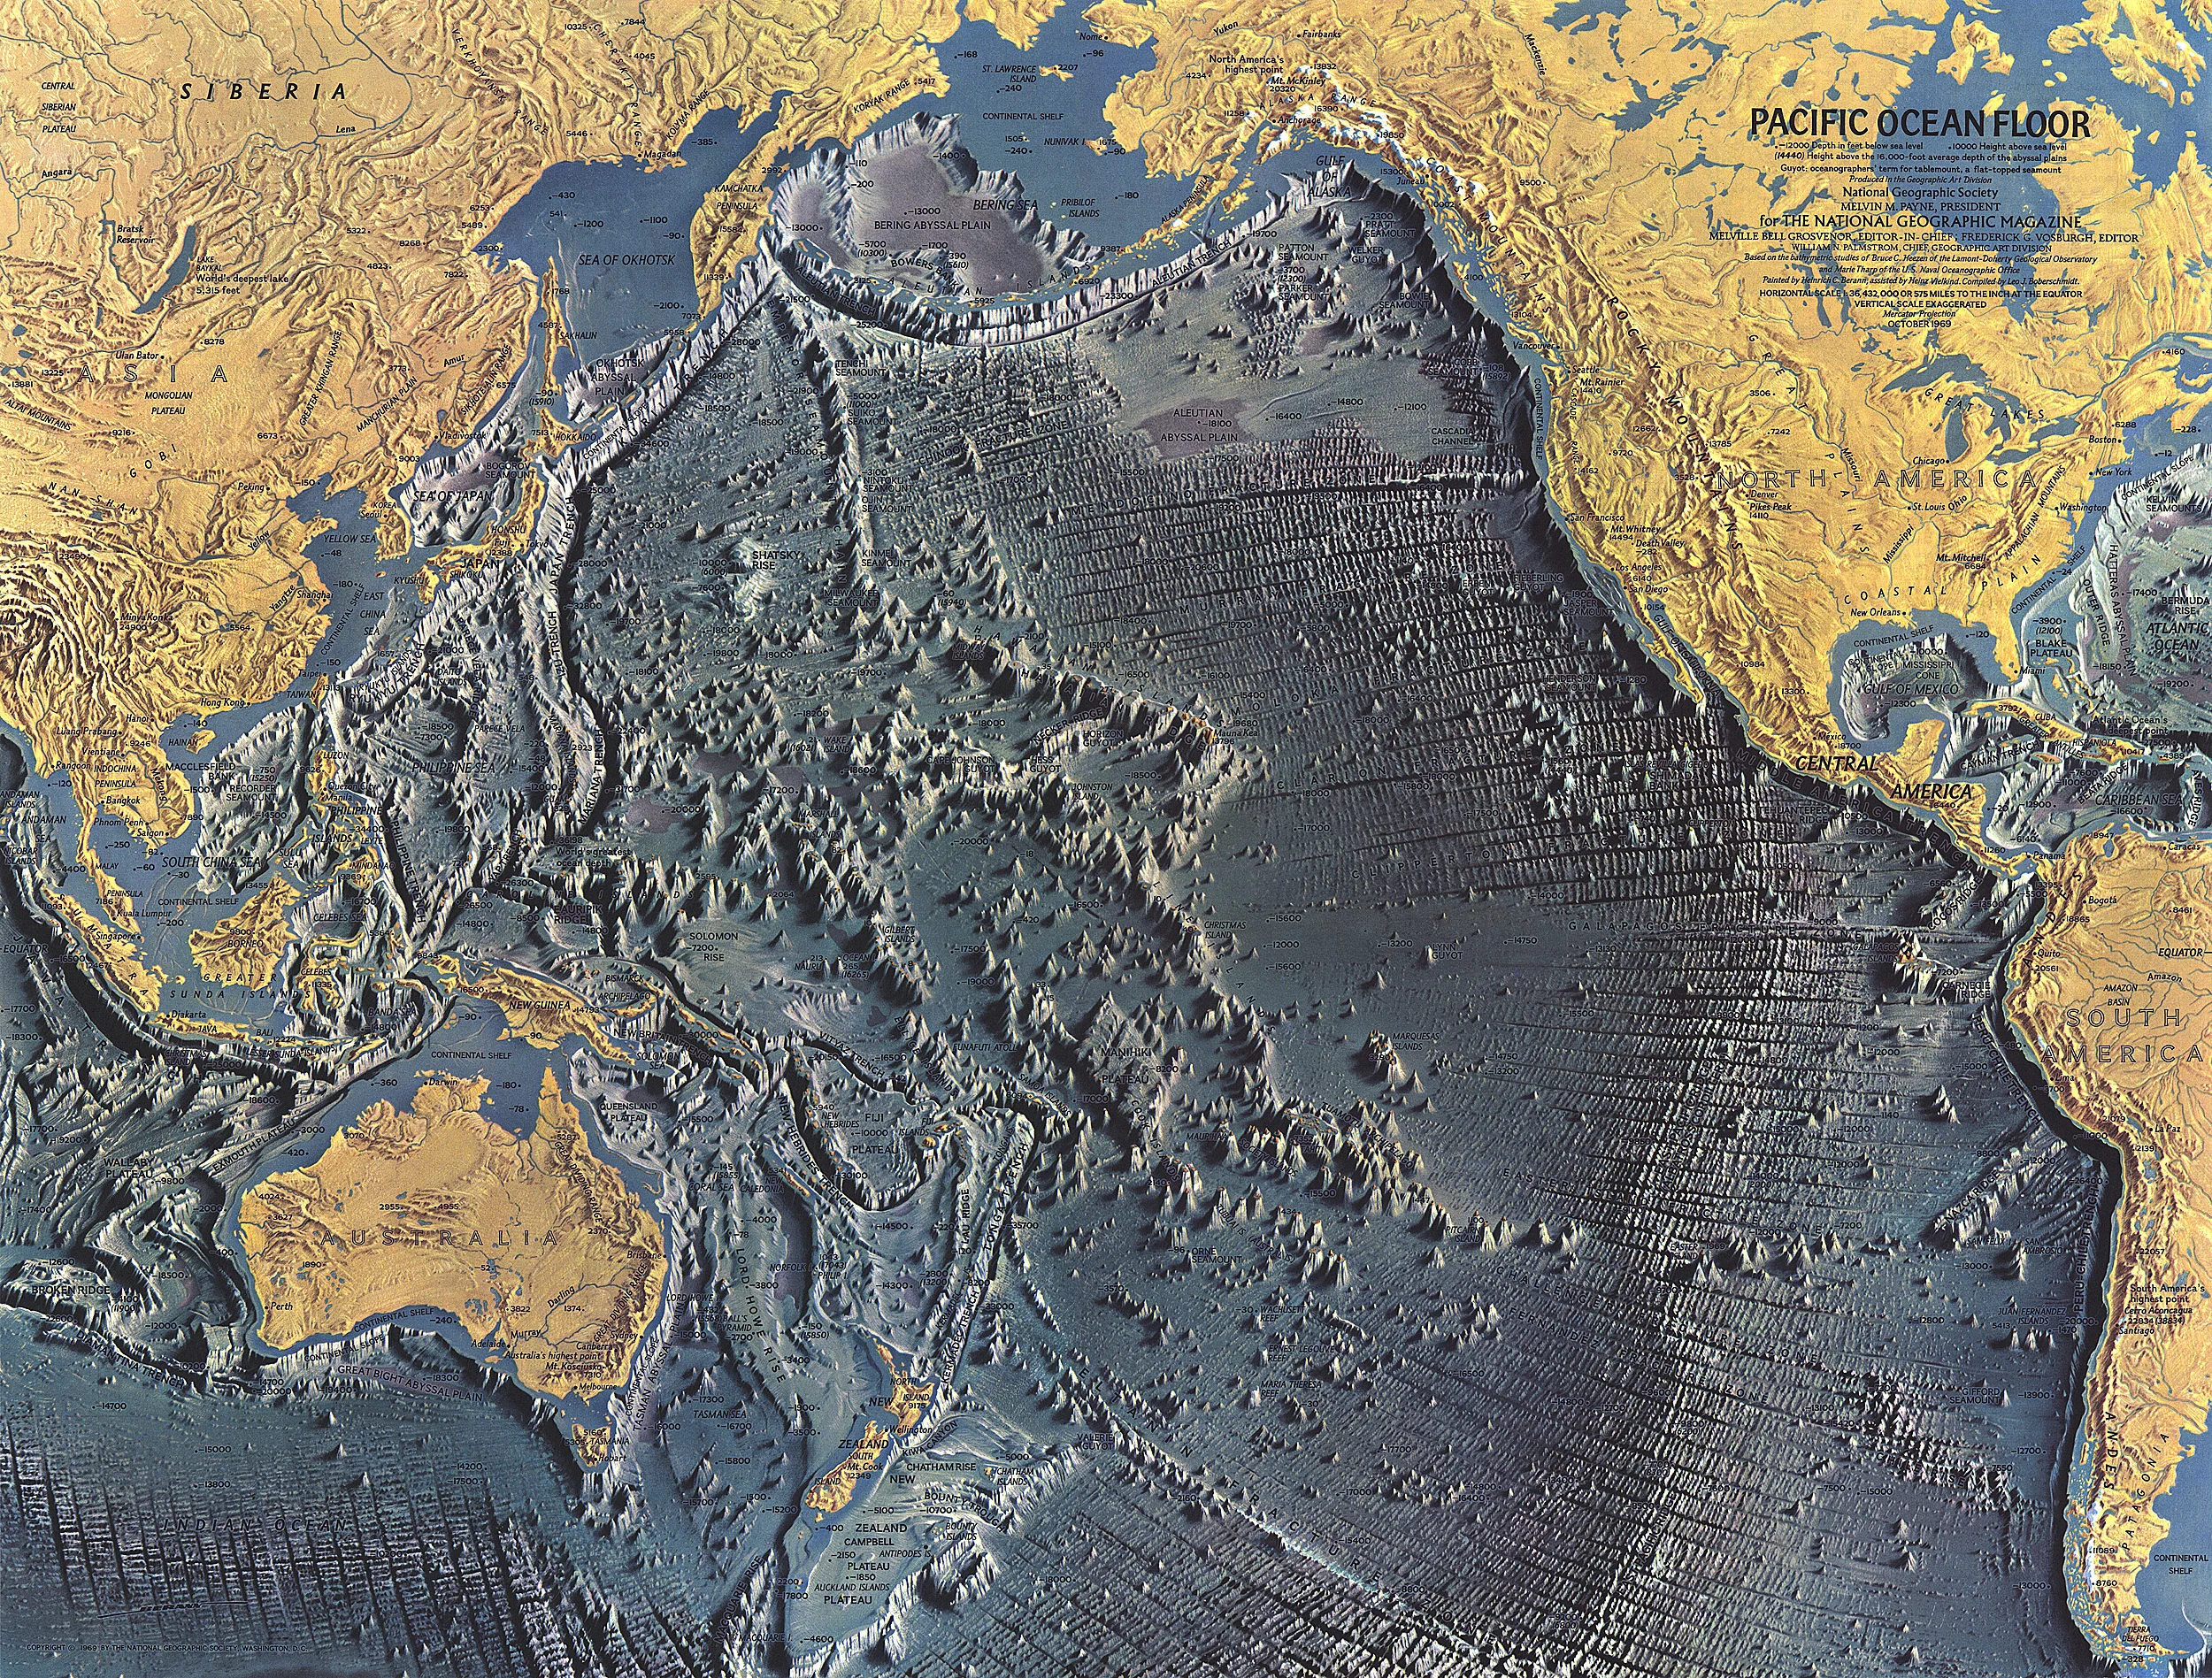
The Pacific Ocean isn't just sinking due to rising seas, parts of it are also vanishing from our measurements. The Pacific faces the highest climate risks, yet effective monitoring depends on strong and well funded data systems, which are currently insufficient.
Why Poorer Countries Can't See Storms Coming
Every forecast, every cyclone warning, every evacuate now alert starts the same way with machines on the ground or in the upper air physically sense the weather. Rich countries built dense webs of these machines decades ago and have maintained them, while poorer nations were promised the same baseline instruments but never received them, creating stark disparities. The further down the income ladder a country sits, the thinner its coverage becomes, with the Pacific's smallest island states most exposed to storms sitting at the bottom of that ladder.
Hover any bar for its exact coverage and gap percentage.
| Region / Category | Current Coverage | Required Target |
|---|
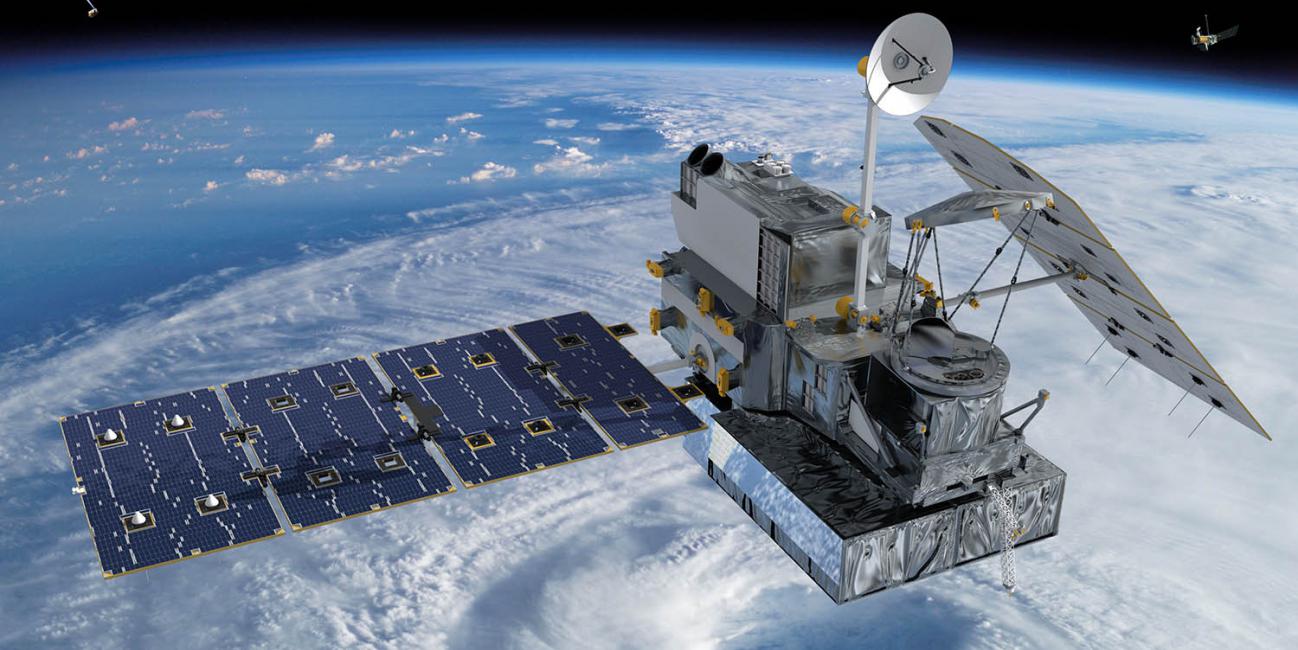
Satellites can observe storm systems from space, but they cannot measure the crucial shifts in pressure, temperature, and humidity that turn a typical squall into a catastrophic cyclone. Without this essential ground truth, early warning systems become unreliable, they are left guessing when disaster may strike. This shortfall has severe consequences for vulnerable populations, as highlighted by the World Meteorological Organisation's (WMO) standards for effective monitoring.
100 Years of Barely Any Progress
If we map exactly when every active land weather station in the Pacific was built, the pattern becomes visually obvious. Infrastructure went in decades ago in bursts, then growth slowed to a crawl for most countries, and for three, Nauru, Niue, and Pitcairn, it never started at all.
Hover any cell for the exact station count that year.
What Happens When You Can't Track a Storm
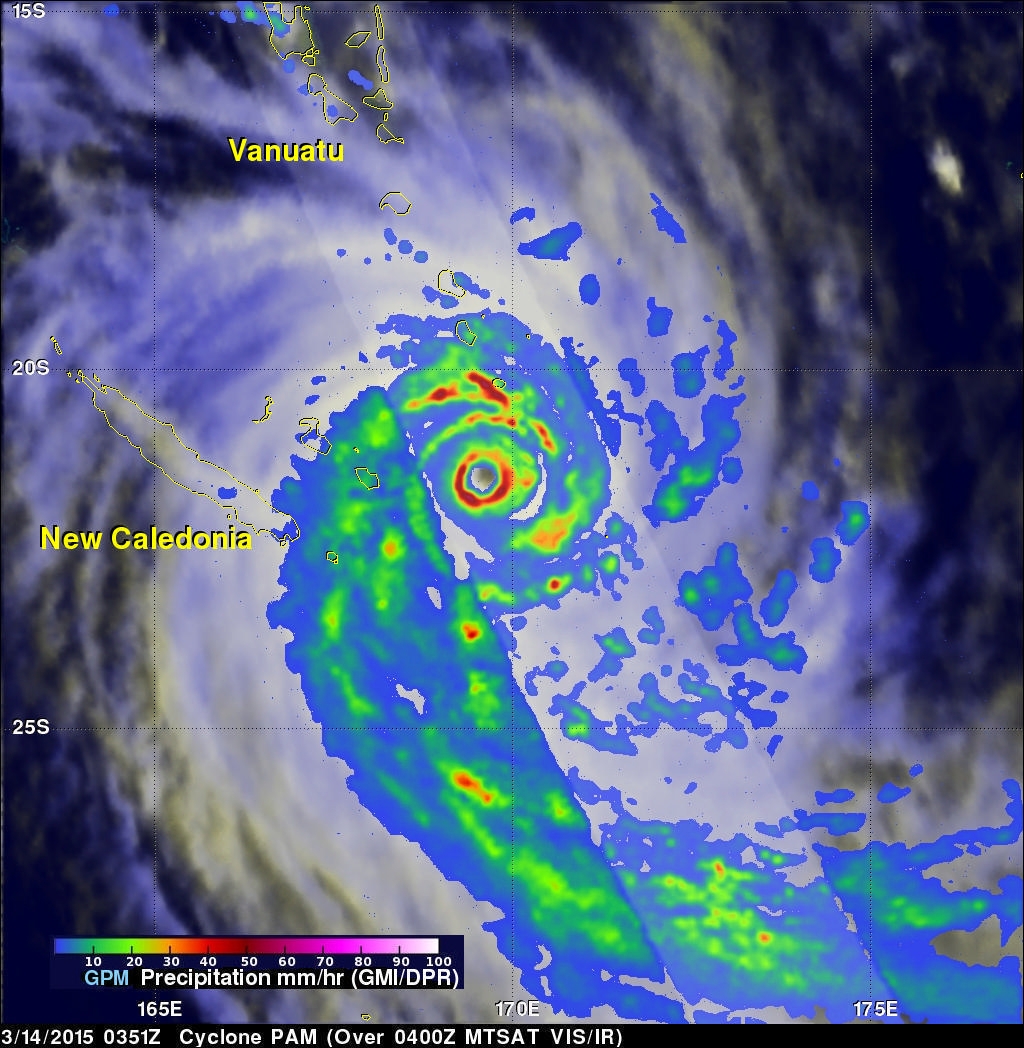
Vanuatu is a useful place to see what this gap actually costs. It gets hit by cyclones and floods most years, and most years the damage barely registers. Then, every so often, one storm sweeps through and the number of people affected jumps from a few thousand to hundreds of thousands in a single season. The chart below plays that pattern out year by year, for Vanuatu, and for every other Pacific country this story tracks.
That up and down pattern is exactly what you'd expect when ground level data is thin. Without local stations to pin down a storm's path and strength, forecasters have to lean on rougher satellite estimates, and the time people have to evacuate shrinks from days to hours.
Neglected monitoring equipment doesn't show up as a line item on a budget, it shows up as disaster recovery bills and unprotected communities, chart after chart, year after year.
Hover any bar for the exact figure that year.
| Year | Affected Persons |
|---|
Chart defaults to Vanuatu; select another country above to see its figures (full country dataset in data.js).
Which Pacific Nations Have Funding, and Which Don't
Regional averages hide how uneven this gap really is. Some island nations are still years from having a single new station funded, while a handful have already broken through to hardware money.
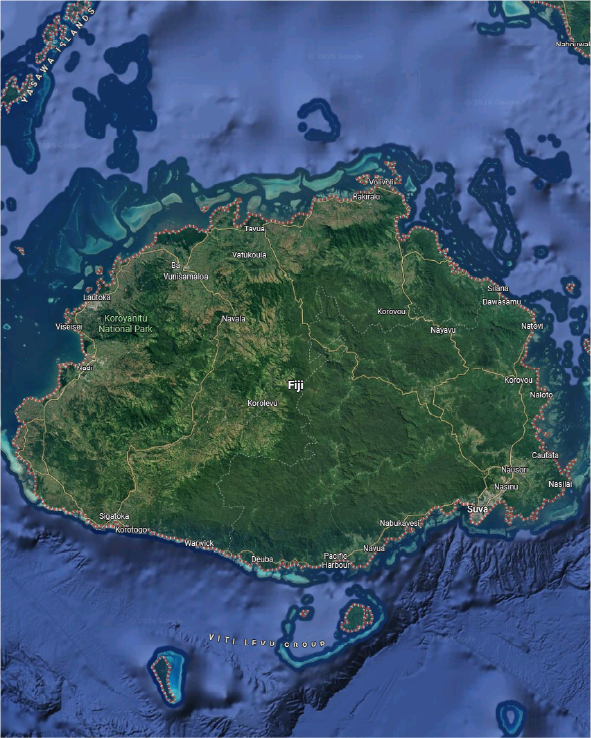
Because Fiji is the primary regional forecasting hub, it operates over 20 active GBON ground stations.
Fiji serves as the region's forecasting hub with just 8 stations, and SOFF Investment Phase funding for new hardware is still pending.
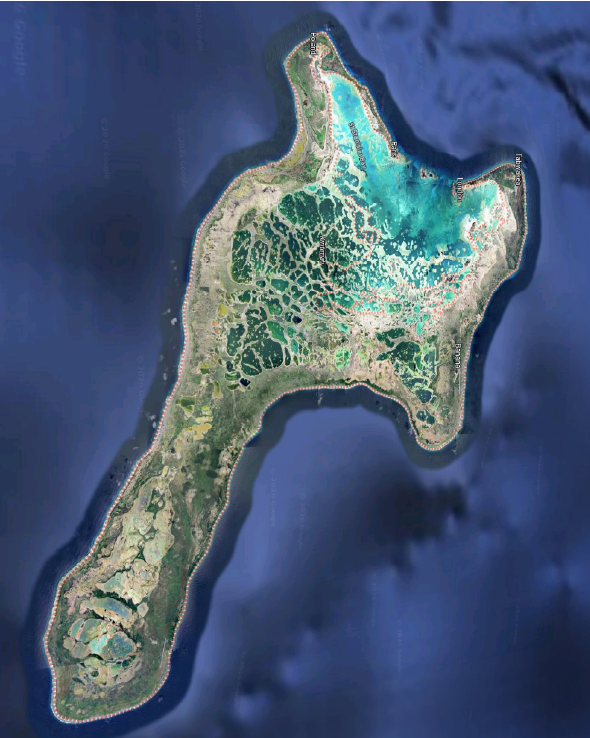
Kiribati has already secured full SOFF Investment Phase funding, worth $11.16 million.
None of Kiribati's 4 stations meet the compliance target of 14, but with $11.16M in Investment Phase funding already secured, new hardware is on the way.
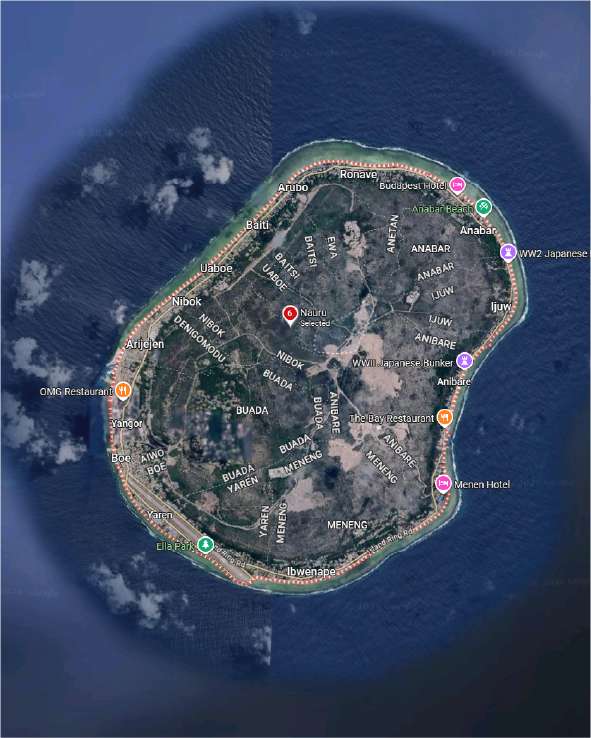
There are exactly zero permanent, sovereign fixed land weather stations reporting baseline data in Nauru.
Zero working stations today, but Nauru is approved for Investment Phase funding to close that gap entirely.
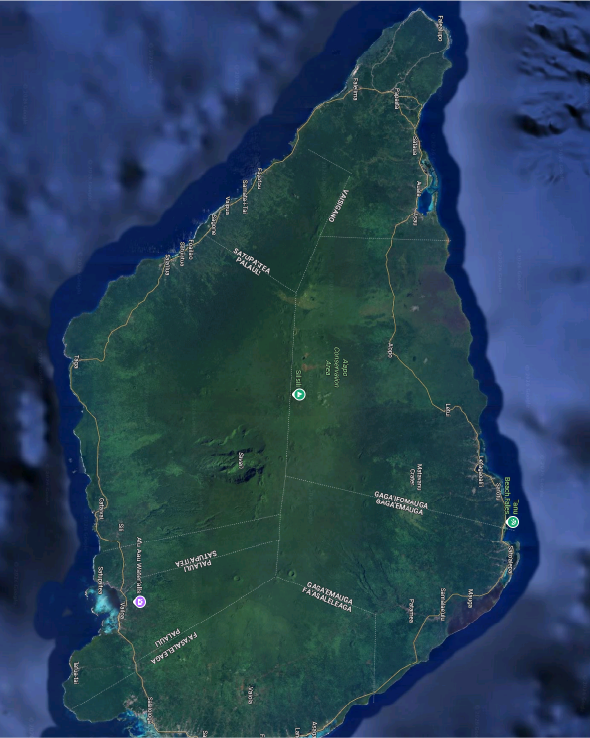
Samoa relies primarily on external satellite feeds rather than sovereign ground observation.
With just 2 stations, Samoa leans on satellite feeds for now, but it's one of four Pacific nations already approved for Investment Phase funding.
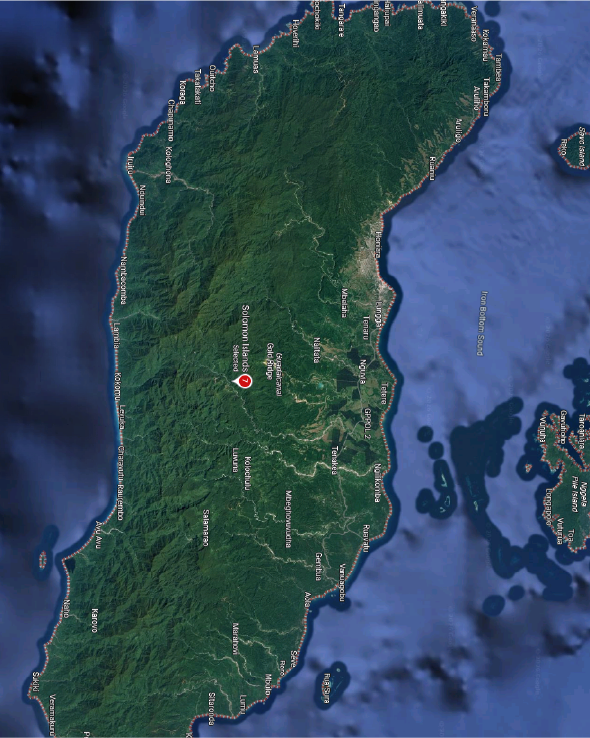
Despite its scattered, fragmented geography, the Solomon Islands has been approved for full SOFF Investment Phase funding.
Just 3 stations cover this fragmented archipelago, but full Investment Phase funding is now approved to help close the gap.
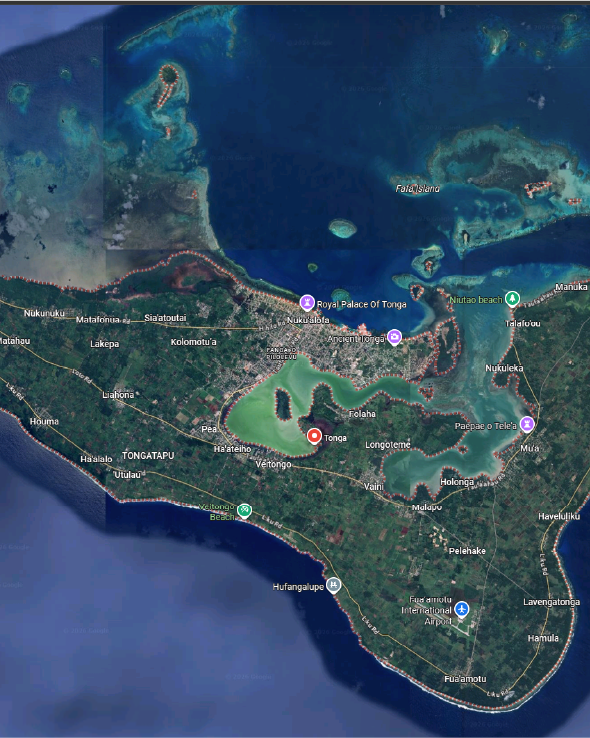
Following recent volcanic and tsunami shocks, Tonga operates more than 10 permanent monitoring stations.
Just 4 stations remain after recent volcanic and tsunami shocks, and Tonga is still waiting on Investment Phase funding to expand.
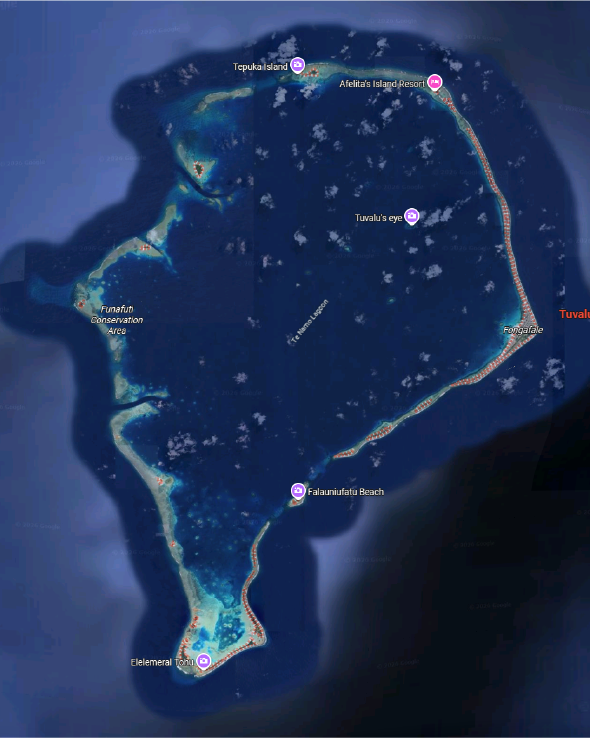
A dense early warning sensor grid matches Tuvalu's extreme vulnerability to sea-level rise.
Only 3 stations watch over one of the nations most exposed to sea-level rise, and Investment Phase funding is still pending.
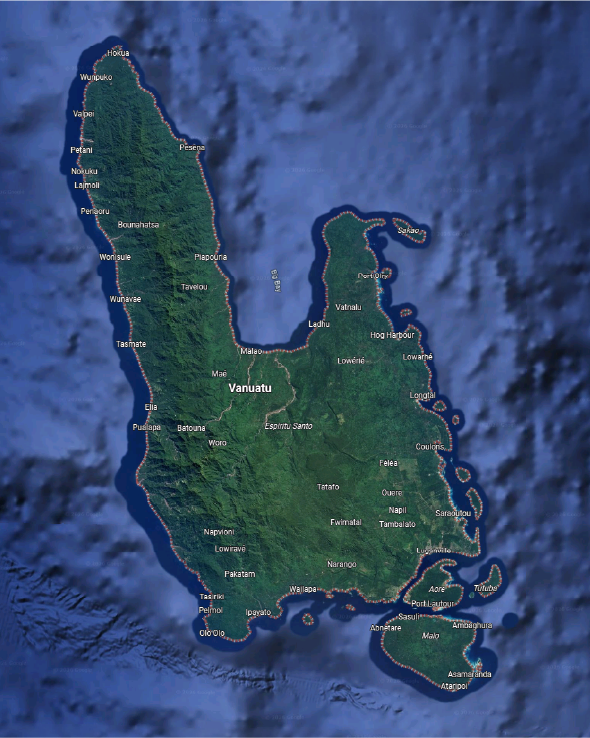
As one of the world's most disaster-prone archipelagos, Vanuatu maintains over 20 surface stations.
One of the world's most disaster-exposed nations runs on just 6 stations, with Investment Phase funding still pending.
Rising Seas Are Making It Worse
Sea-level rise doesn't arrive as a single dramatic flood. It arrives as a road that used to flood only in the worst storms, and now floods on an ordinary high tide. At the Pago Pago, American Samoa gauge, that's a trend visible within a single generation, quietly reshaping what counts as normal weather.
Where that trend goes next is a matter of how much the world emits between now and the year 2100, the ruler below lays out the range. But for atolls that sit barely three meters above the waterline, even the most optimistic pathway means extreme tides and cyclone-driven storm surges pushing critical infrastructure toward being permanently flood-prone, without rapid adaptation.
Hover any bar for the exact flood-day count that year.
| Year | Flood days |
|---|
Projected sea-level anomaly by the year 2100: +53.0 cm
The axis below uses a split vertical scale to capture the massive leap between the historical record (bottom left) and future reality (top right). The dashed line bridges the gap between the 12 cm shift we've already experienced and the extreme 40+ cm projections for 2100. Click any scenario dot, or use the pathway selector above.
| Series | Value |
|---|
Who's Paying to Fix This
The United Nations set up a fund called SOFF (the Systematic Observations Financing Facility) to pay for exactly this kind of weather equipment on the ground and in the upper air. It's the closest thing this story has to an answer already in motion. The chart below tracks Readiness budgets against investment phase advisory fees, a small slice of the total full hardware investment approvals run into the millions of dollars per country once a country clears the pipeline.
A mechanism to close this gap already exists, backed by partner advisors and implementing entities like UNEP, UNDP, and the World Bank. The work left is not inventing a solution, it is pushing the countries still doing paperwork through to the investment phase. That is a funding and political-will problem, not a technical one.
Of the 14 Pacific countries in the current funding pipeline: 4 approved for SOFF Investment Phase funding (Kiribati, Solomon Islands, Samoa, Nauru)
Tap a name above to jump to it below, or hover any row on the chart for its exact dollar figures.
| Country | Phase | Entity | Partner | Status | Readiness Budget | Investment Peer Advisory Fee | Total |
|---|
The Fix Is Possible, It Just Needs Funding
The Pacific's monitoring gap isn't a fact of geography. It's a shortage of equipment and funding, and that can be fixed. As the planet keeps warming and extreme weather keeps getting worse, the cost of flying blind, in lives and in money, only keeps growing.
Early warning systems are one of the most cost-effective tools humanity has against climate disasters, the WMO puts the return at nearly tenfold roughly ten dollars in avoided damage for every dollar spent. But they only work if there's hardware on the ground, satellites overhead, and steady funding to keep both running.
That shortage is a real barrier to building resilient infrastructure and taking meaningful climate action, the two goals the United Nations set for every country under SDG 9 and SDG 13.
Pacific nations are on the front line of a crisis they didn't cause. Giving them the basic tools to see a storm coming is not too much to ask, it's the least the rest of the world owes them.
Methodology & Sources
This data story relies exclusively on verified open data from regional authorities, the UN Systematic Observations Financing Facility (SOFF), the World Meteorological Organisation (WMO), the Pacific Data Hub (SPC), and World Bank Climate Risk Country Profiles. Full access to raw data files and processing scripts is provided below.
Primary Documents & Registries
- Kiribati SOFF Investment Phase Funding Request UN SOFF
- Directly Affected Persons by Disasters Pacific Data Hub
- Direct Disaster Economic Loss, Average Annual Loss Pacific Data Hub
- Meteorological Monitoring Network, Land Stations Pacific Data Hub
- Climate Risk Country Profiles & Sea Level Projections World Bank CCKP
- Historical High Tide Flooding Days NOAA
- SOFF Portfolio and Implementation Progress UN SOFF
- WMO GBON Global Baseline Diagnostic Report World Meteorological Organisation
- Terrain Imagery & Country Maps Google Earth & Google Maps